
Background Information
This study can be used to support the out-group homogeneity effect’s explanation of stereotype formation. The out-group homogeneity effect is a hypothesis that claims members of in-groups will perceive members of their own group as being more diverse than an out-group and they will perceive out-group members as being more similar to one another.
If things are homogeneous it means they are alike.
This can explain how stereotypes are formed for out-groups since stereotypes are generalizations about groups of people. In order to make a generalization, you have to create a simplified (and generalized) description of that group of people (e.g. Old people are bad drivers; boys are more adventurous than girls; girls in that sorority love to party, etc.). If you think that an out-group is more similar, it becomes easier to create that generalization.
If we combine this with social identity theory, we can see how negative stereotypes of out-groups could be formed: we want to view out-groups as inferior in some way to boost our own self-esteem by comparing that inferior group with our superior in-group.
This experiment can also provide some evidence in support of social identity theory since it shows that the groups demonstrated ethnocentrism (i.e. in-group biases) when rating their in-groups and out-groups on a range of characteristics.
At the time of this study (1982), the authors claim there was little evidence to support the out-group homogeneity hypothesis, so the primary aim was to test this hypothesis. There were four experiments in this series, but we’ll be looking at the third (Original Study link).
Methods (Experiment #3)
The researchers worked with three sororities at the University of Oregon. They wanted to see if members of the sororities would demonstrate the out-group homogeneity effect – that is to say, they wanted to see if sorority girls would think of their own members as being more different to one-another than the members of other sororities. In other words, if participants perceived the girls in other sororities were more similar to one-another than their own sorority, they would be demonstrating the out-group homogeneity effect. The researchers chose three sororities that were similar to one another in terms of proximity and values.
There were 90 participants (about 30 from each sorority). The data was gathered using questionnaires. The girls were asked to rank their own sorority and an out-group sorority on ten dimensions. Those dimensions were:
- Strictness of house rules and regulations
- Studiousness (how much they studied)
- How well they dressed
- How much they partied
- How physically attractive they were
- How much they helped others (philanthropic activities)
- How sexually active they were
- Economic status
- Group cohesiveness (how “tight” the girls in the sorority were)
- How frequently they were asked out on dates
In the questionnaire, the girls were asked to rank their own sorority and the other two in terms of how characteristic each of these dimensions were for the group. There responses could range on a 7 point scale, ranging from 0 – not at all characteristics to 7 – extremely characteristic.
For example, a question might look something like this:
Rank how characteristic this statement is of each of the sororities, including your own (A) and the two others (B and C):
- Values studiousness and the girls take their academics seriously.
- Sorority A = 0 – 1 – 2 – 3 – 4 – 5 – 6 -7 (extremely characteristic)
- Sorority B = 0 – 1 – 2 – 3 – 4 – 5 – 6 -7
- Sorority C = 0 – 1 – 2 – 3 – 4 – 5 – 6 -7
- Dress well and take pride in their appearance.
- Sorority A = 0 – 1 – 2 – 3 – 4 – 5 – 6 -7
- Sorority B = 0 – 1 – 2 – 3 – 4 – 5 – 6 -7
- Sorority C = 0 – 1 – 2 – 3 – 4 – 5 – 6 -7
- Girls are frequently asked out on dates.
- Sorority A = 0 – 1 – 2 – 3 – 4 – 5 – 6 -7
- Sorority B = 0 – 1 – 2 – 3 – 4 – 5 – 6 -7
- Sorority C = 0 – 1 – 2 – 3 – 4 – 5 – 6 -7
- Are generally considered by others to be very attractive.
- Sorority A = 0 – 1 – 2 – 3 – 4 – 5 – 6 -7
- Sorority B = 0 – 1 – 2 – 3 – 4 – 5 – 6 -7
- Sorority C = 0 – 1 – 2 – 3 – 4 – 5 – 6 -7
etc.
Questions were asked for all ten dimensions and the results were compiled.
This first part of the experiment was to measure ethnocentrism: did the girls view their own sorority more positively than the others? The results showed that this was the case and these results will be discussed in more detail below.
To measure the out-group homogeneity effect, the girls were also asked to compare the intragroup similarity for each of these dimensions. That is to say, they were asked to rank how similar to one-another the girls in each of the sororities were.
Here’s an example question:
“Consider only girls in sorority [A]. Using the following scale, how similar or dissimilar are the [As] to one another?”
- 0 – 1 – 2 – 3 – 4 – 5 – 6 – 7 – 8 – 9 (extremely similar)
The scale was a 9 point scale, ranging from 0 (extremely dissimilar) all the way to 9 =(extremely similar).
Results: Out-group Homogeneity
The results showed that girls in all three groups viewed their own sorority members as being more dissimilar than the other girls thought they were. In other words, they thought out-group members were more similar to one-another than their own in-group members were to each other. Thus, they were demonstrating the out-group homogeneity effect.
This is a good experiment to role play in class so you can comprehend the methodology and results.
In terms of explaining stereotypes, we can see how this view of out-group members as being similar to one-another could make it easier to make generalizations about that group of people and since stereotypes are generalizations of groups, the out-group homogeneity effect could explain how stereotypes are formed. For example, there could be a stereotype that one sorority is a party house while another is full of geeks and do-gooders.
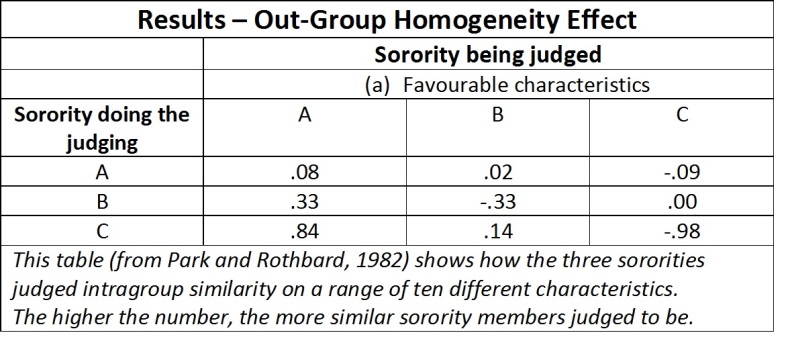
If out-group homogeneity effect is occurring, the number in the falling diagonal should be lower than the other two numbers in the same column. Is this the case?
Results: In-group Bias (Ethnocentrism)
The results also showed that in all three groups the girls tended to view partying and being sexually active as unfavourable characteristics, and the other eight as favourable, so the two were analyzed separately.
For the eight favourable characteristics, all groups said that they were more characteristic of their own sorority than the other sororities. This shows in-group bias and can support social identity theories explanation of how belonging to a group can lead to in-group bias and favouritism, possibly as a result of wanting to boost one’s self-esteem and positive social identity.
For the two unfavourable characteristics, in-group bias was shown in two of the sororities as they ranked the unfavourable characteristics as being more characteristic of the other sororities than their own. This is more evidence to explain how the cognitive process of social identity – social categorization and social comparison – can lead to in-group bias.
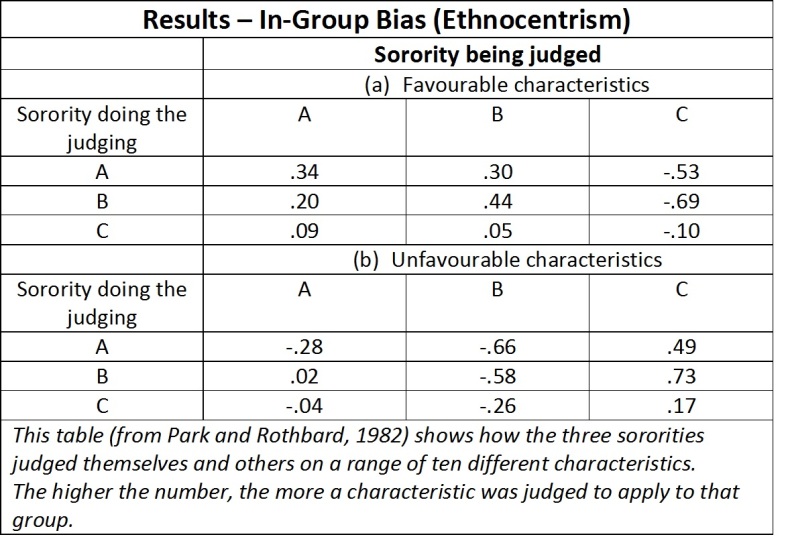
For favourable characteristics, in-group favouritism is shown if the number in the falling-diagonal cell is higher than the other numbers in that column (more characteristic). For unfavourable characteristics, that number should be lower (less characteristic).
Here’s a video of SIT and it contains an explanation of this study…
Critical Thinking Considerations
- Can the out-group homogeneity effect explain all types of stereotypes? If not, what are some types of stereotypes that it can’t explain?
- To what extent do you think these results can be generalized to other types of in-groups and out-groups?
- This study was conducted over 30 years ago. Is there a reason to think we couldn’t expect the same results today?
Reference
Park, Bernadette, and Myron Rothbart. “Perception of Out-group Homogeneity and Levels of Social Categorization: Memory for the Subordinate Attributes of In-group and Out-group Members.” Journal of Personality and Social Psychology 42.6 (1982): 1051-068
Travis Dixon has been teaching for over 20 years and is an experienced IB Psychology, History and English teacher, author, workshop leader and examiner