The purpose of this activity is to help you learn about correlational studies and correlation coefficients.
Key Questions:
- What are three characteristics of a correlational study?
- How do correlational studies differ from experiments?
- How and why are correlational studies used in one or more approaches to understanding behaviour?
Resources
- Textbook 6.1f, pg 320-321 (IB Psychology: A Student’s Guide) (Link)
- Correlation coefficient calculator (link)
- Pen and paper
Your Task
You are going to learn about correlation studies by actually doing your own correlation calculations on existing data (from Levine et al.’s 2001 cross-cultural study on helping behaviour: link) and then you will gather your own data to correlate.
Task #1: Calculating Correlations
- First of all, you’ll need to read the textbook pgs. 320-321 to learn what a correlation coefficient is and what they mean.
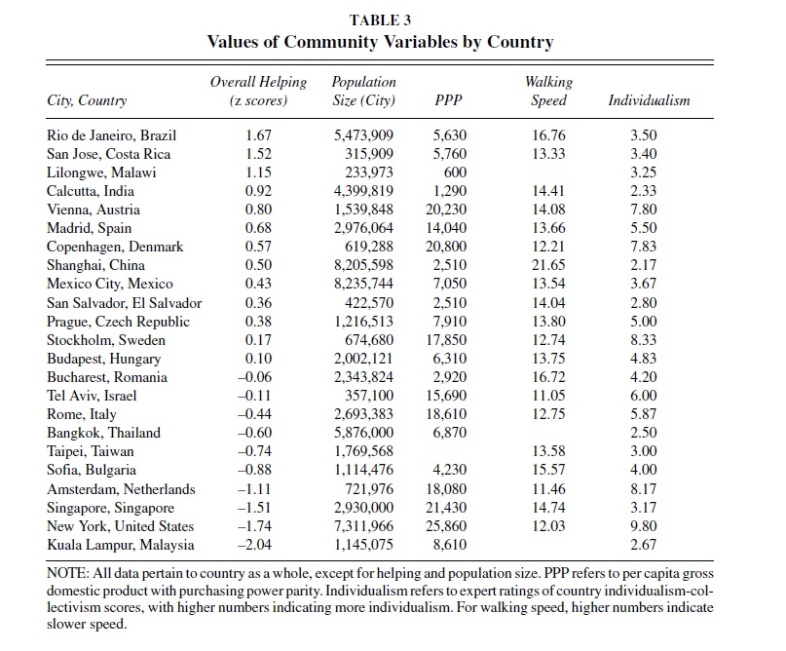
- Once you’ve done this, work with a partner to use the table below from Levine et al.’s (2001) cross-cultural study on helping behaviour to calculate a correlation coefficient for two sets of data. For example, you might think that individualism and PPP could be correlated, so you would use data from these two columns.
- Choose two columns of data that you think might have a positive or negative correlation and use this calculator to input the data and calculate the correlation coefficient. What’s the result? Was your prediction accurate? What are some possible explanations of these results?
- Important Note: If one of the countries is missing data for one of the columns, skip that country completely – if you don’t it will mess up your results. e.g. There is no walking speed measure for Malawi so if you were correlating this with individualism, you would skip Malawi’s data out of your list and go straight from Costa Rica to India and move on.

This data has been taken from Levine et al.’s (2001) cross-cultural study on helping behaviour. Select two columns and find the correlation coefficient.
Task #2: Calculating YOUR OWN Correlations
Once you’ve done the above task on existing data, it’s time to go one step further and collect your own data from your classmates (or other students) and see if you can find a correlation between two things.
Here are some ideas for correlations, but try to come up with your (and have it checked with your teacher first):
- Height and foot size
- Resting heart rate and average amount of exercise
- Average hours homework and how much you like school
- Average hours watching TV and average hours exercising
- Time on social media / screen time and …?
- Hours of sleep and…(mood / energy / ?)
Now go and get your data and use the calculator to see if there’s a correlation.
Note: you might be tempted to correlate something with grades or something else personal. This raises some ethical issues involved in the research process and so you should work with your teacher to decide how to deal with these ethical considerations.
Remember: correlations are usually calculated between two sets of continuous data, not discrete data*. Continuous data is data that has infinite possible values and cannot be lumped into categories. If it can be lumped into categories, it is discrete data and this could be variable for a quasi-experiment, but not for a correlational study.
For example, if you wondered how people got to school (bus, walk, bike, car, etc.) affected their grades, these are categories and cannot have a range of values so they’re discrete data, not continuous data and so cannot be used for a correlational study (although might make for an interesting quasi-experiment).
*There are variations of correlational methods that can test relationships between discrete data, such as phi correlations. For a high school psychology course, it’s enough to focus on correlational studies that measure relationships between two sets of continuous data.
Fast Finishers Extension #1
Try to find at least five studies in the course that measure correlations.
- Are they used in some approaches or topics more than others?
- Can you explain how and why correlational studies are used in particular topics of the course?
You can find some more interesting correlations here! Can you see what’s wrong with the titles of all of these graphs?
IB Psychology Exam Tip
When preparing to write about research methods in Paper 1 and Paper 2 of the IB Psychology course, I recommend focusing on either experiments, case studies or correlational studies. These are the most common and are easier to explain than other methods.
Travis Dixon is an IB Psychology teacher, author, workshop leader, examiner and IA moderator.
